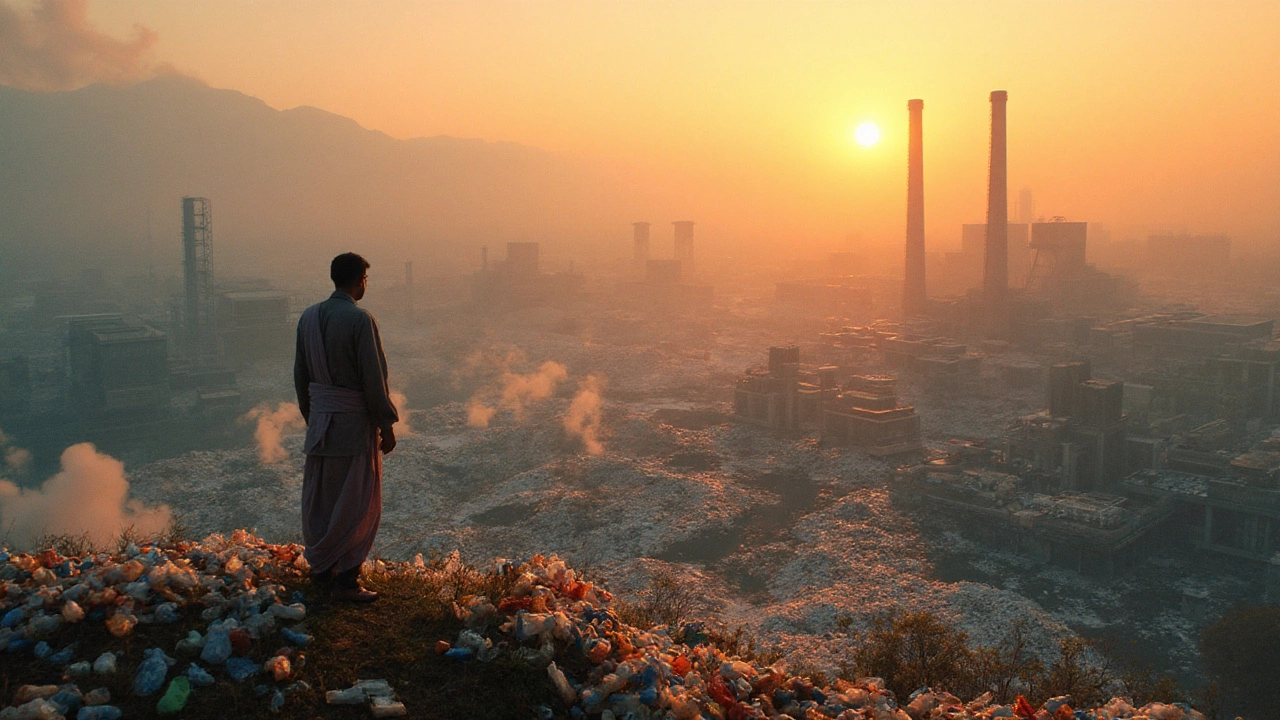
Single-Use Plastic Statistics: What the Numbers Really Mean
Single‑use plastics dominate the waste stream, but the raw numbers can feel overwhelming. Let’s break down the most recent stats so you can see what’s happening, why it matters, and where you can make a difference.
In 2023, India produced roughly 9.5 million tonnes of plastic waste, and about 60% of that came from single‑use items like bags, straws, and packaging. That’s the equivalent of stacking the Taj Mahal’s height in plastic bags over and over. Even more alarming, only 9% of the total plastic waste was formally recycled, leaving a massive portion to end up in landfills or the open environment.
Key Sources and Their Share
When you dig into the data, a few sources dominate:
- Packaging: 45% of single‑use plastic waste. Food wrappers, beverage bottles, and retail packaging are the biggest culprits.
- Retail bags: 20% of the total. Despite bans in several states, low‑cost polyethylene bags remain widely used.
- Hospital and medical items: 12% – masks, gloves, and syringes surged during the pandemic.
- Food service items: 15% – cutlery, plates, and straw usage skyrocketed with take‑away culture.
- Other: 8% – includes personal care products, cleaning agents, and miscellaneous items.
These percentages highlight where interventions can have the biggest impact. Targeting packaging redesign and encouraging reusable alternatives can cut nearly half of the waste.
What the Trends Show
Year‑over‑year, single‑use plastic generation has risen by about 4% since 2020. However, some positive signals are emerging:
- States with strict bag bans reported a 30% drop in plastic bag litter within two years.
- Corporate commitments to eliminate virgin plastic in packaging have grown from 15% of major brands in 2021 to 38% in 2024.
- Community recycling drives in metros have increased collection rates from 7% to 12% of total plastic waste.
These numbers prove that policy, corporate action, and grassroots effort can shift the curve, but the pace needs to accelerate.
Another useful metric is the “plastic leakage” rate – the amount that escapes formal waste systems and enters the environment. In coastal regions, studies estimate a leakage of 2.5 million tonnes per year, which is roughly one‑third of the country’s total plastic waste. This leakage fuels ocean plastic pollution, harms marine life, and eventually circles back to us through the food chain.
Understanding these statistics helps you decide where to focus your efforts. If you run a small business, swapping to biodegradable packaging can cut your contribution by up to 40%. For consumers, switching to reusable bags, cups, and containers can shave off 2–3 kilograms of waste per person annually.
So, what can you do next?
- Audit your own plastic use: Track how many single‑use items you touch in a week.
- Choose alternatives: Opt for reusable cloth bags, stainless steel bottles, and paper or compostable packaging where available.
- Support local recycling: Participate in community collection drives or partner with businesses that offer take‑back schemes.
- Advocate for policy: Encourage local officials to enforce existing bans and introduce stricter standards for packaging.
The numbers may look daunting, but each small change adds up. By knowing the stats, you gain the power to cut waste where it hurts most and help India move toward a cleaner, more sustainable future.

Who Is the Largest Producer of Single-Use Plastic? - Global Rankings & Impact
Discover why China tops the list as the biggest single-use plastic producer, explore the data behind global output, and learn what it means for waste and policy.
