September 2025 Archive – What Happened in Manufacturing This Month?
Welcome to the September 2025 roundup. In just three posts we covered a global plastic leader, the reasons behind India’s pharma dominance, and the steel legacy of two American cities. Each piece gives you concrete data, clear takeaways, and a glimpse of where the industry is heading.
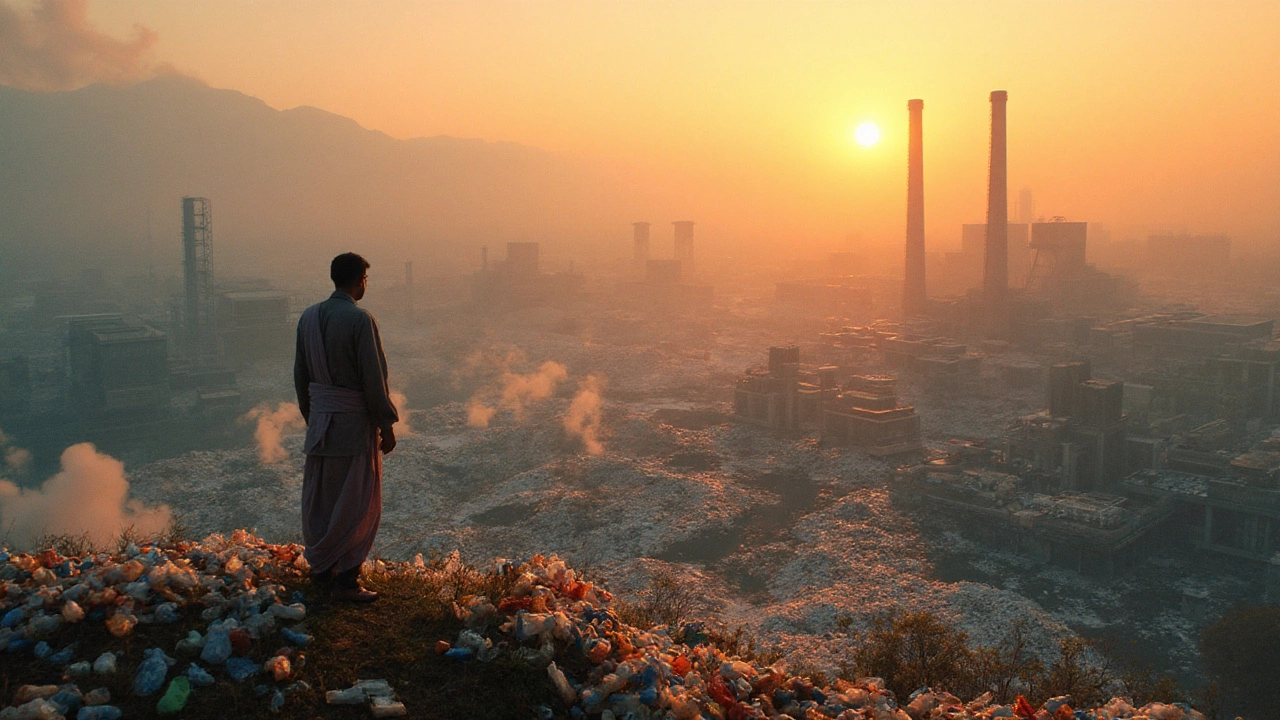
Global Plastic Production Rankings
The first article peeled back the numbers that put China at the top of single‑use plastic output. We broke down 2024 production stats, showed how China’s 40% share dwarfs the next largest producer, and explained why that matters for waste management and policy. The piece also highlighted how the surge in packaging demand and low‑cost manufacturing fuel the trend, while pointing out emerging regulations in Europe and the U.S. that aim to curb the flow.
What’s useful for you? Knowing the biggest source helps predict where supply‑chain disruptions might hit, and which markets are likely to feel the pressure of tighter plastic bans. If you work in packaging, recycling, or compliance, the data set in the post is a quick reference for risk assessments.
India’s Pharma Powerhouse
The second post answered a simple question: why does the world turn to India for medicines? We dug into three core factors – lower production costs, massive manufacturing capacity, and a skilled workforce that can scale quickly. By 2025, India supplies roughly 20% of global generic drugs, and the trend is set to rise as more U.S. FDA‑approved plants come online.
We also explored the outlook for vaccines and active pharmaceutical ingredients (APIs). With government incentives and a push for self‑reliance, the sector is poised to attract $30 billion in new investment over the next two years. For investors or supply‑chain managers, the article outlines the risk‑reward balance of sourcing from Indian manufacturers.
The third piece compared two iconic steel towns: Pittsburgh, Pennsylvania and Birmingham, Alabama. Pittsburgh earned the nickname “Steel City” thanks to its boom in the early 1900s, while Birmingham’s iron ore reserves made it a key player in the South. We laid out a quick cheat sheet that lists historic output, current production facilities, and the economic shifts each city faces today.
Why care? If you’re tracking heavy‑industry trends, knowing which U.S. hubs still hold manufacturing clout helps you spot investment opportunities and workforce development programs. The article also points out that both cities are reinventing themselves – Pittsburgh with advanced alloys and Birmingham with renewable‑energy‑focused steel plants.
All three posts tie back to a common theme: manufacturing is global, but local policies and cost structures shape where growth happens. Whether you’re a supplier, regulator, or curious reader, the September archive gives you actionable insight in plain language.
Feel free to dive deeper into any of the articles. Each one links to data sources, case studies, and expert quotes that let you verify the numbers yourself. Stay tuned for October’s updates – more trends, more numbers, and more practical tips for the manufacturing world.

Who Is the Largest Producer of Single-Use Plastic? - Global Rankings & Impact
Discover why China tops the list as the biggest single-use plastic producer, explore the data behind global output, and learn what it means for waste and policy.

Why So Many Pharmaceuticals Are Made in India: Costs, Capacity, and 2025 Outlook
India makes a big share of the world’s medicines. Here’s the real reason: cost, scale, skills, regulations-and what it means for quality, risk, and 2025.

Which U.S. City Is Known for the Iron and Steel Industry? Pittsburgh vs Birmingham
Quick answer: Pittsburgh is the Steel City. See why it earned the title, how Birmingham fits in, and a cheat sheet of other key U.S. steel towns, past to present.